Single Tenant Net-Leased (NNN) Investment Market Report- Q1 2018
by Michal Ben-Moshe, Senior Marketing Director
Posted on May 22, 2018 at 14:20 PM
SHARE POST
Single Tenant Net-Leased overview Q1 2018
The Ben-Moshe Brothers of Marcus & Millichap (NYSE:MMI) conducted a recent market research to examine the Net-Leased Single Tenant (NNN) cap rates of Q1 2018 compared to Q4 2017. As part of the research, we collected cap rates for STNL properties that were either on the market or sold in Q4 2017 and Q1 2018. The sources include public records, Marcus and Millichap’s MNET system, Costar, Crexi and Loopnet. We then calculated average cap rates for multiple sectors in Q3 Vs Q4. For full disclosure purposes, we were not able to capture every STNL property that was sold in these time frames. Additionally, the methodology and the data collected from the research may not be 100% accurate, but can absolutely provide a great overview on the STNL market.
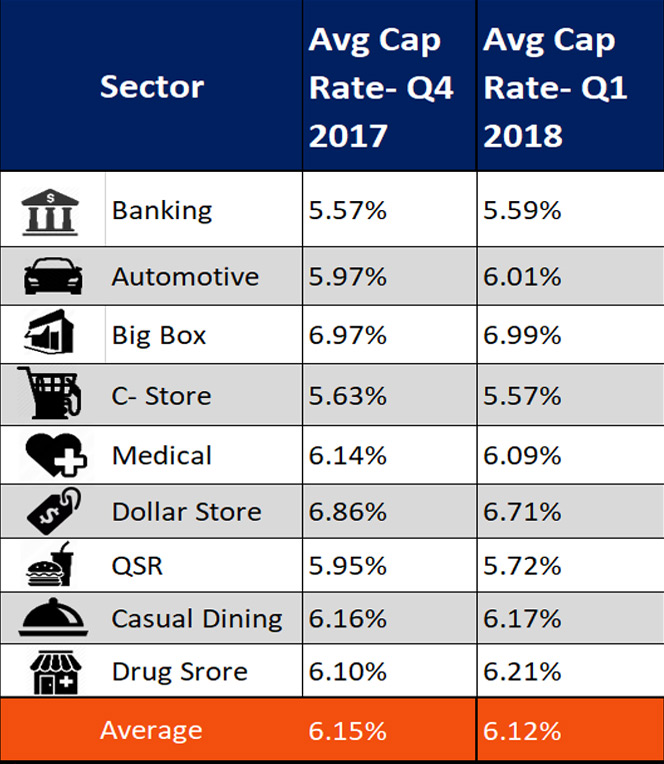
Overall, we see a slight decrease in the average cap rates for single tenant net leased from Q4 2017 to Q1 2018. In Q4 2017 the average cap rates for single tenant net leased was standing on 6.15%, while in Q1 2018 it was standing on 6.12%, an overall 3-bps decrease. Although the decrease in cap rates is moderate, in our opinion it reflects a stronger market in the beginning of 2018.
“The new Trump tax reform helped to create a positive outlook in the beginning of 2018”, says Roee Ben-Moshe, a Single Tenant Net Leased expert and Co-Founder at The Ben Moshe Brothers of Marcus & Millichap. “In general, the new tax reform provided some benefits for property owners, developers and 1031 exchange buyers, and slightly increased their demand and confidence.” “In addition, we can attribute the slight decrease in cap rate to relatively steady 10 year in the beginning of Q1 2018 (January) and an increase of 2.9% in the GDP in Q1 2018 over Q1 of 2017 last year. This reflects an acceleration of the U.S. economy.”, says Leeor Ben-Moshe, a Single Tenant Net Leased expert and Co-Founder at The Ben-Moshe Brothers of Marcus & Millichap.
As to specific STNL sectors, we see that E-commerce resistant tenants including QSR, casual dining, medical and convenience stores have a high demand amongst investors, especially 1031 exchange buyers. These sectors are the most attractive sectors for investors in 2018 and therefore reflect a cap rate compression.
SINGLE TENANT SECTORS IN Q1 2018
• In the Banking sector, we saw an increase in cap rates of approximately 2-bps. That is due to multiple challenges in the banking industry tied to regulations, legacy systems, technologies and new competitors. The movement for online and mobile banking is picking up speed and challenging the business for existing physical locations. Big banks are losing business to smaller competitors and some start-ups, as they are facing challenges in adapting to the fast-changing tech world. For example, Walmart’s Bluebird services provides an alternative to debit and checking and effectively turning 4,000 Walmart stores into bank branches. Another example is Google which is developing a virtual credit card that is linked to users' Google Wallet account. As a result, big banks, such as, Wells Fargo, has announced to close stores, and the banking sector remain uncertain with low demand among investors.
• In the Automotive sector, we saw a small increase in cap rates of approximately 4-bps. In our opinion it reflects the growth in popularity of electric cars and the long-term uncertainty regarding the need in automotive services, such as oil changing.
• We also saw a small increase in cap rates of approximately 2-bps in the Big Box sector. We see this increase as part of the of retail e-commerce preference, such as Amazon and Walmart online. Moreover, more than 70 million square feet of retail space is already slated to close in 2018, which is negatively affected investor confidence. Fox example, Toys R Us' shops are closer to 50,000 square feet, on average. Sears is closing 103 stores, Walmart's Sam's Club division is closing 63 stores, Bon-Ton is closing 42 stores, and J.C. Penney is closing 8 stores and Nordstrom is closing one store.
• In the Convenience Store sector, we saw a decrease in cap rates of approximately 6-bps. In our opinion, although there are some concerns about the need for convenience stores due to electric cars, such as Tesla and other hybrids, the decrease is related to convenience stores with high-quality tenants, such as Wawa. In addition, in our opinion, the decrease in cap rates is also contributed to the fact that convenience stores, such as Wawa and 7-Eleven are now focusing more on innovation, customer experience and food quality.
• In the Medical sector, we continue to see a decrease of 6-bps in cap rates. We believe that the compression is attributed by the fact that the medical properties are considered “Amazon Proof” or another term used is “E-commerce Resistant” and therefore are safer for investments. Another factor is the increase in consumer demands for more convenient, cost-effective and scheduling flexibility medical care. According to Urgent Care Industry overview reports, Individuals with private insurance are more likely to seek medical treatment at an urgent care center than a hospital. The strong demand for urgent cares contributs to increase in new construction of medical and urgent care product, such as MedExpress.
• In the Dollar Store sector, we saw a decrease of 15-bps in cap rates. The decrease in the average cap rate can be contributed to the fact that the industry revenue has expanded. Operators began investing in aesthetics and customer service to improve the overall shopping experience. Due to the strong demand among costumers, Dollar General to announced to open 900 stores in 2018 and Family Dollar is growing to higher density areas. Even though Amazon's lunched $10 & Under section, it is missing the big selection at the local dollar store.
• In the Fast Food sector (QSR) we saw the largest compression of 23-bps in cap rates. In our opinion, the change in cap rates of QSR is contributed by increase in customer demand for fast food restaurants and some improvements in the industry. Fast food restaurants are now offering higher quality experiences and full-service locations by offerings like mobile ordering and home delivery. In addition, QSR companies are now improving the food ingredients and providing more healthy options. The change in cap rates of QSR is also contributed to the fact that the QSR market is also an “e-commerce resistance”, which provide for confidence among investors to invest in that sector. This can vary depending on the size of the guarantor, operating experience, location, brand, and credit.
• In the Casual Dining sector, we saw an increase in cap rates of approximately 1-bps. On one hand, this sector is seeing an increase in customer demand and improving in costumer experience and quality of food. On the other hand, some operators in this sector are in bankruptcy, such as Applebee’s franchisees.
• In the Pharmacy sector we saw an increase in cap rates of approximately 11-bps. In our opinion, the increase is contributed to the uncertainty in this sector in the beginning of 2018, due to Amazon interest in the pharmacy space last year. Fears that Amazon would penetrate the Drug Store sector since late 2017, affected the stock market and Companies like CVS Health were seen vulnerable. In April of 2018, Amazon decided to withdraw their plans. We will be monitoring the effects on this sector in Q2 2018.
CONCLUSION
The information provided in the article provides a general understanding of Single Tenant Net-Leased (NNN) Investment Market. In order to make the right investment decisions it is important to have an open conversation with commercial real estate investment advisor and to reevaluate the investment strategies, under the constantly changing market.
© The content provided in this article is owned by The Ben-Moshe Brothers of Marcus & Millichap and is subject to Copyright Laws.