Single Tenant Net-Leased (NNN) Investment Market Report- Q4 2017
by Michal Ben-Moshe, Senior Marketing Director
Posted on February 16, 2018 at 14:40 PM
SHARE POST
Single Tenant Net-Leased overview Q4 2017
The Ben-Moshe Brothers of Marcus & Millichap (NYSE:MMI) conducted a recent market research to examine the Net-Leased Single Tenant (NNN) cap rates of Q3 2017 compared to Q4 2017. As part of the research, we collected cap rates for STNL properties that were either on the market or sold in Q3 2017 and Q4 2017. The sources include public records, Marcus and Millichap’s MNET system, Costar, Crexi and Loopnet. We then calculated average cap rates for multiple sectors in Q3 Vs Q4. For full disclosure purposes, we were not able to capture every STNL property that was sold in these time frames. Additionally, the methodology and the data collected from the research may not be 100% accurate, but can absolutely provide a great overview on the STNL market.
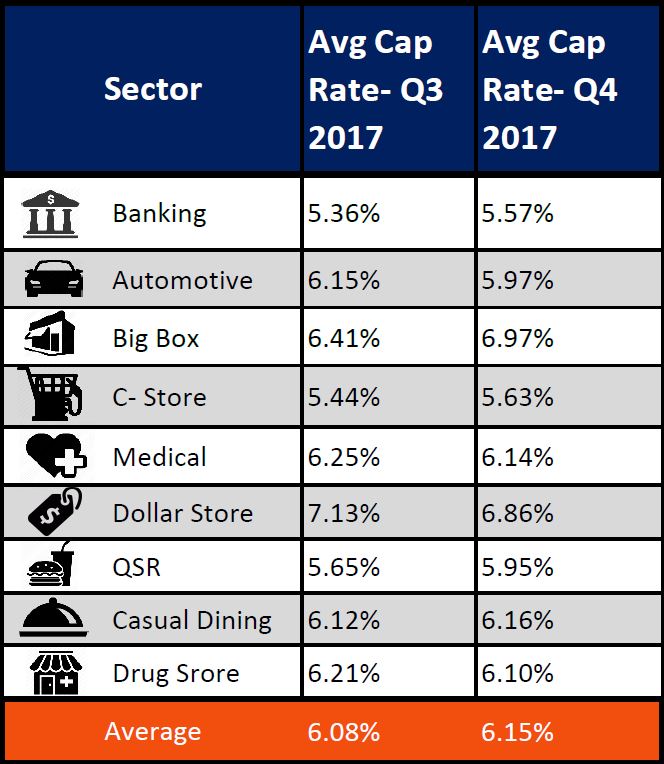
Overall, we see that the average cap rates from Q3 to Q4 increased by 7-bps, from 6.08% in Q3 to 6.15% in Q4. In our opinion, the increase in cap rates are directly correlated to the increase in interest rates, which increased by 0.25% in December 2017. We also feel that the sharp rise in Bitcoin trading as well as a rise in the supply of Net Lease (NNN) investments in the market were a part of the increase in cap rates. Despite the recent increases in cap rates, it is important to understand that we are still at historic lows for cap rates of Single Tenant Net Leased (STNL) investments nationwide.
• In the Banking sector, we saw an increase in cap rates of approximately 21-bps. That is due to consumers’ increasing preference for online and mobile banking. Additionally, Wells Fargo has announced that it will close more than 200 branches and more in 2018.
• In the Automotive sector, we saw a compression in cap rates of approximately 18-bps. That is due to an abundance of new construction, such as O’Reilly Auto Parts, and an increase in the number of other credit rated tenants during Q4.
• We also saw a significant increase in cap rates of approximately 56-bps in the Big Box sector. We see this increase as part of the of retail e-commerce preference, such as Amazon and Walmart online. Moreover, multiple big boxes are being forced to close stores and that has negatively affected investor confidence. Fox example, in November 2017 Target announced its intention to close a dozen stores right after the holiday season. Also, Toys R Us, filed for bankruptcy in September of 2017 and has announced more stores closures.
In the Convenience Store sector, we saw an increase in cap rates of approximately 19-bps. In our opinion the increase related to concerns about the need for convenience stores due to electric cars, such as Tesla and other hybrids. Overall, convenience stores with high-quality tenants, such as Wawa, had cap rates between 4 percent and 5 percent in 2017.
• In the Medical sector, we witnessed a surprising decrease of 11-bps in cap rates. We believe that the compression is attributed by the fact that the medical properties are considered “Amazon Proof” or another term used is “E-commerce Resistant” and therefore are safer for investments. Another factor is the increase in new construction of medical and urgent care product, such as MedExpress, AFC, NextCare, CareNow and more, due to consumer demands for more convenient healthcare.
• In the Dollar Store sector, we saw a decrease of 27-bps in cap rates. An increase in the amount of properties with long term leases on the market aided in the overall compression. In addition, supply of single tenant dollar store properties, such as Dollar General and Family Dollar, increased significantly in the fourth quarter of 2017, mostly with properties that were new construction. Another factor is the fact that the majority of the properties that were sold in that sector were located in primary markets.
• In the Fast Food sector (QSR) we saw an increase of 30-bps in cap rates. This sector includes a variety of tenants with different cap rates, such as Wendy's NNN, KFC NNN, Taco Bell NNN, Captain D's NNN, Checkers NNN, Dunkin Donuts NNN, and many more. The QSR sector is different from other Single Tenant Net Leased sectors because the majority of these properties are guaranteed by franchisees rather than corporate entities. Cap rates of QSR Single Tenant Net-Leased assets guaranteed by franchisees can vary widely, but mainly based on the amount of locations the franchisee has in their operations as well as the health of their companies. The change in cap rates of QSR investments were negatively affected by of the increase of the amount of short term leases versus long term leases that were on the market. Short term leases have more strict lending requirements, a smaller buyer pool and therefore trade at higher cap rates. Another factor in the changing average cap rate was the increase of Single Tenant Absolute Triple-Net (NNN) investments compared to Ground Leases. Single Tenant Absolute Triple-Net (NNN) investments typically trade at higher cap rates than Ground Leases due to their higher price points.
Single Tenant Net-Leased Forecast 2018
Contrary to the increase of cap rates in Q4 2017, we are now witnessing a slight compression in cap rates and pick up in the market since the beginning of 2018. “The new Trump tax reform and the volatility in the Dow Jones helped create a positive outlook for 2018”, says Roee Ben-Moshe, a Single Tenant Net Leased expert and Co-Founder at The Ben Moshe Brothers of Marcus & Millichap. “We expect that the demand for single net leased properties will remain strong in 2018. The 1031 exchange buyers and private buyers will continue to purchase these assets at the compressed cap rates, as they offer a safety net to hedge against inflation in 2018. Overall, as long as the 10-year treasury remains relatively stable, we expect cap rates to be stable as well.”
As to specific STNL sectors, we believe that the QSR and Medical sectors will be the most attractive sectors for investors in 2018. “These asset classes are less affected by e-commerce and therefore, they will continue to attract investors, especially 1031 exchange buyers”, says Leeor Ben-Moshe, a Single Tenant Net Leased expert and Co-Founder at The Ben-Moshe Brothers of Marcus & Millichap.
© The content provided in this article is owned by The Ben-Moshe Brothers of Marcus & Millichap and is subject to Copyright Laws.